
Benchmark Report – April 2023
Each year the MSA is measured against leading MBA programs with comparably-sized enrollment on two-dozen metrics using publicly available data. Why MBA programs? Because too few analytics and data science programs publicly disclose student demographics and outcomes with the thoroughness and consistency needed to accurately benchmark. Also, the variation in cohort enrollment size and program formats make comparisons difficult.
MBA programs have a long history of reporting student demographics and outcomes as a part of the annual ranking process conducted by organizations such as U.S. News. The data are reported under clear and consistent guidelines that make a fair benchmark possible. The Institute follows these guidelines in reporting results for the MSA program. Other analytics and data science programs are encouraged to do the same.
The MSA benchmark study is updated each year (in April) with the latest data from U.S. News. The schools used in the study may change from year to year based on the changes in the annual ranking or program cohort sizes.
Selected for comparison are the top-5 highest-ranked MBA programs with similar cohort sizes to the MSA program, enrolling between 76 and 113 students (the MSA enrollment is 93):
- Emory University (EU)
- University of Washington–Seattle (UW)
- Georgia Tech (GT)
- University of Rochester (UR)
- Notre Dame (ND)
Based on publicly available data, the following metrics are used:
| METRICS | ||||
| Number of Applicants Acceptance Rate Enrollment Enrollment Rate % Female Students % International Students Length of Work Experience % Work Experience Age Undergraduate GPA % Seeking Employment Number Seeking Employment |
Average Base Salary % Reporting Salary Data % Employed at Graduation % Employed 3-Months After Graduation Signing Bonus % Receiving Signing Bonus Tuition and Fees Tuition and Fees – Residents Average Indebtedness % Students with Debt ROI Payback Period ROI Payback Period – Residents |
|||

|
2023 BENCHMARKS |
|||||||
|
Metrics |
MSA |
Top-5 MBA Programs |
|||||
|
Mean |
EU |
UW |
GT |
UR |
ND |
||
|
US News Rank (April 2023) |
— |
— |
17 |
20 |
26 |
27 |
30 |
| Admissions: | |||||||
|
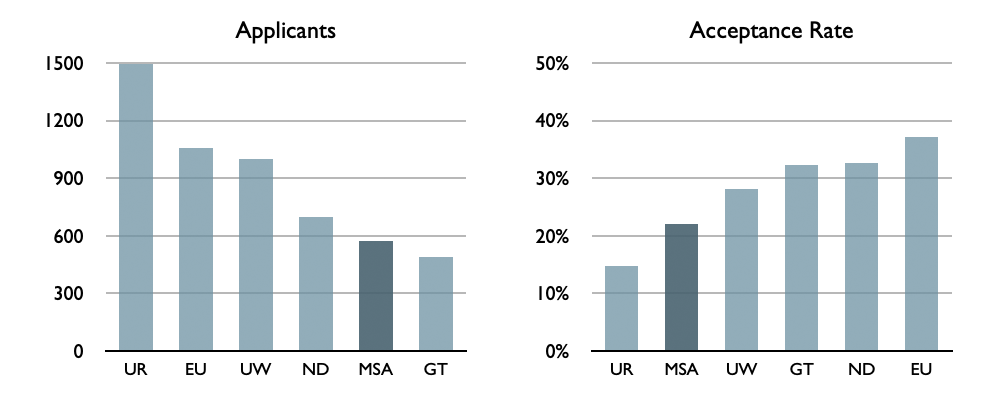
Number of Applicants |
661 |
949 |
1,055 |
1,000 |
492 |
1,497 |
700 |
|
Acceptance Rate |
22% |
29% |
37% |
28% |
32% |
15% |
33% |
|
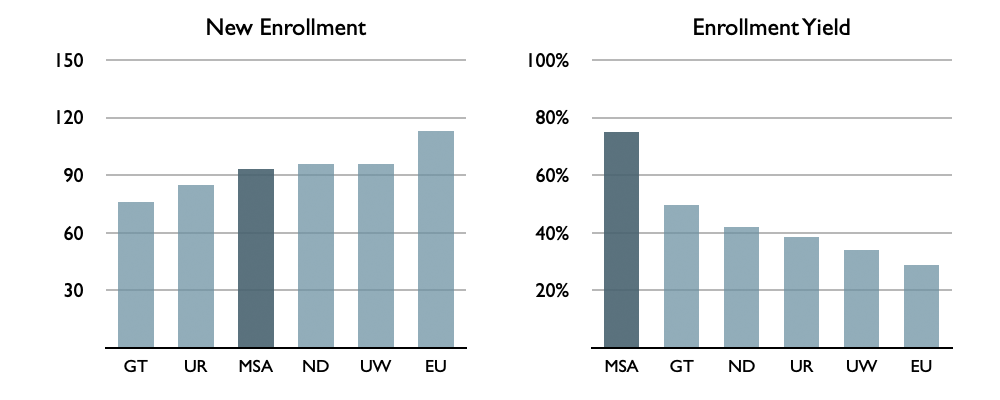
Enrollment |
93 |
93 |
113 |
96 |
76 |
85 |
96 |
|
Enrollment Yield |
75% |
39% |
29% |
34% |
50% |
39% |
42% |
| Student Demographics: | |||||||
|
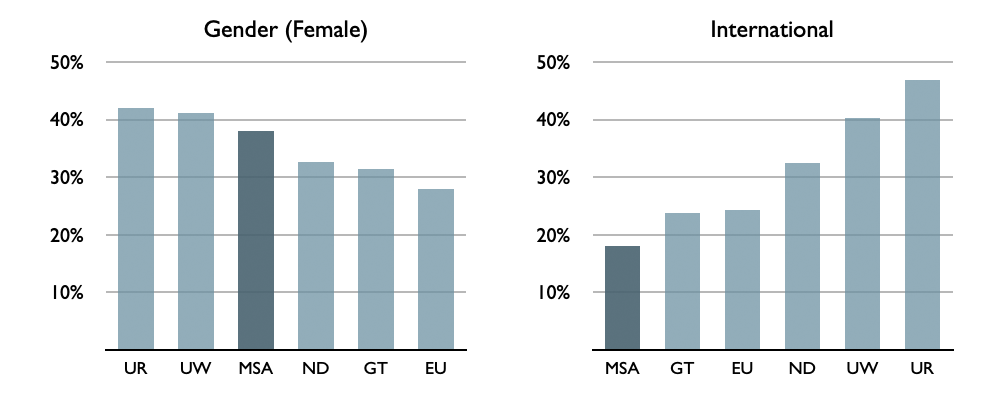
% Women Students |
38% |
35% |
28% |
41% |
31% |
42% |
33% |
|
% International Students |
18% |
33% |
24% |
40% |
24% |
47% |
32% |
|
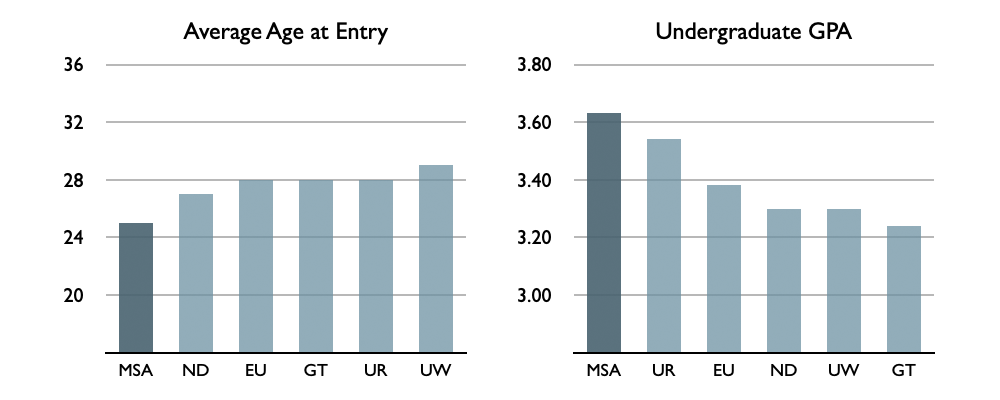
Age |
25 |
28 |
28 |
29 |
28 |
28 |
27 |
|
Undergraduate GPA |
3.63 |
3.35 |
3.38 |
3.30 |
3.24 |
3.54 |
3.30 |
|
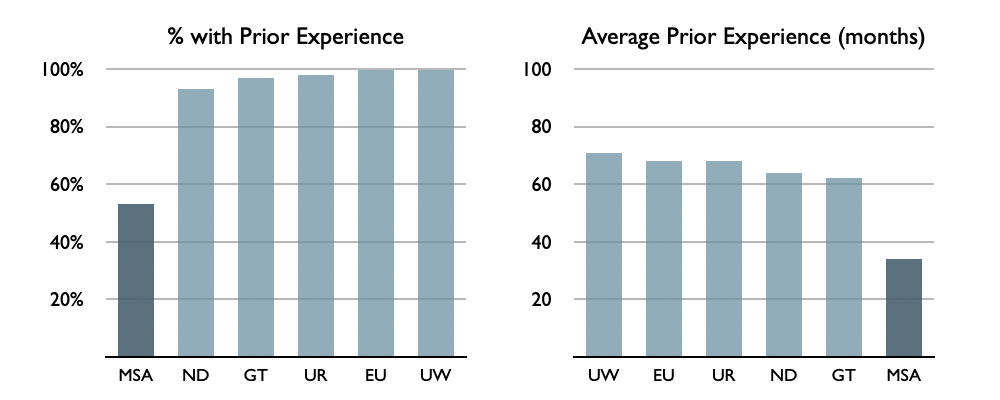
Work Experience (mo.) |
36 |
71 |
71 |
77 |
69 |
77 |
65 |
|
% Work Experience |
53% |
98% |
100% |
100% |
97% |
98% |
93% |
| Employment Outcomes: | |||||||
|
% Seeking New Employment |
100% |
91% |
88% |
95% |
85% |
97% |
89% |
|
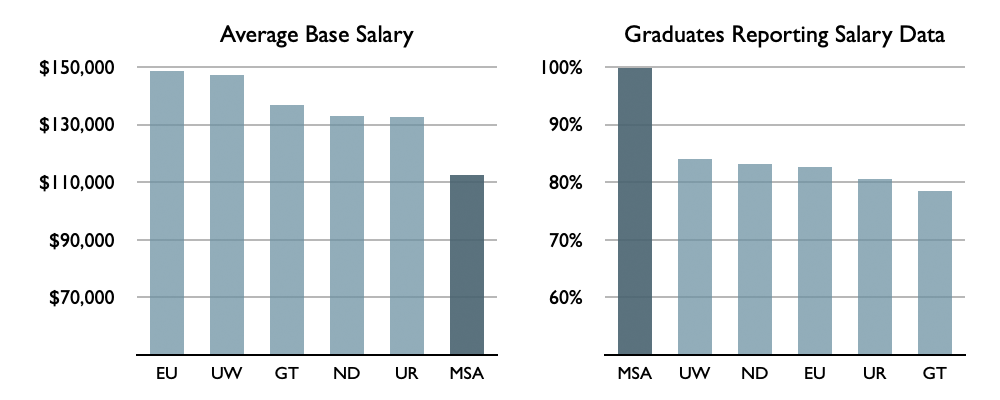
Average Base Salary ($000) |
113 |
140 |
149 |
147 |
137 |
133 |
133 |
|
Reporting Salary Data |
100% |
86% |
83% |
84% |
93% |
90% |
82% |
|
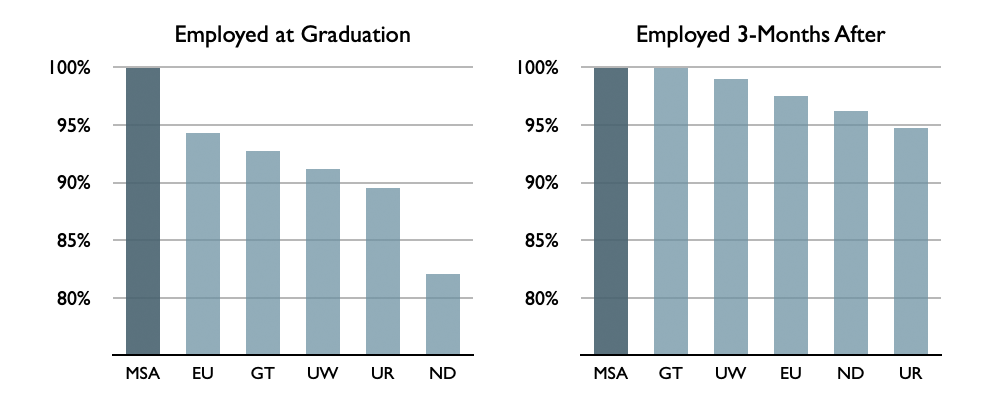
Employed at Graduation |
100% |
90% |
83% |
84% |
93% |
75% |
80% |
|
Employed 3-mo. After Graduation |
100% |
98% |
98% |
99% |
100% |
95% |
96% |
|
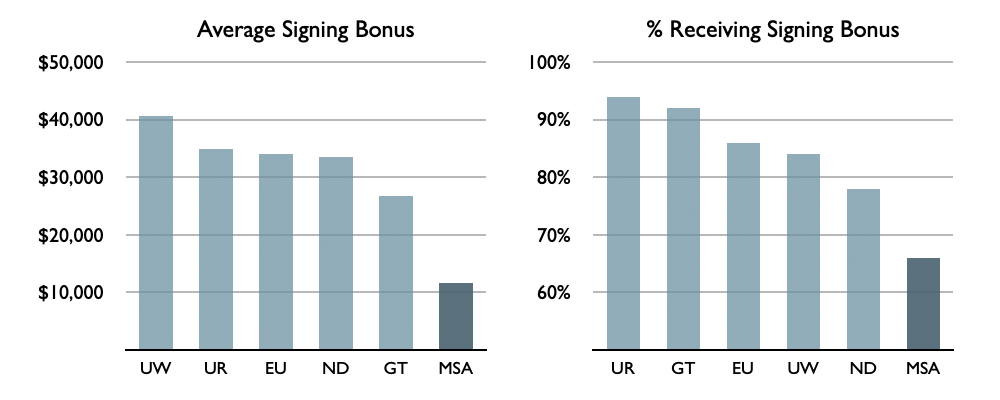
Signing Bonus ($000) |
12 |
34 |
34 |
41 |
27 |
35 |
34 |
|
Students Receiving Signing Bonus |
66% |
87% |
86% |
84% |
92% |
94% |
78% |
| Costs and ROI: | |||||||
|
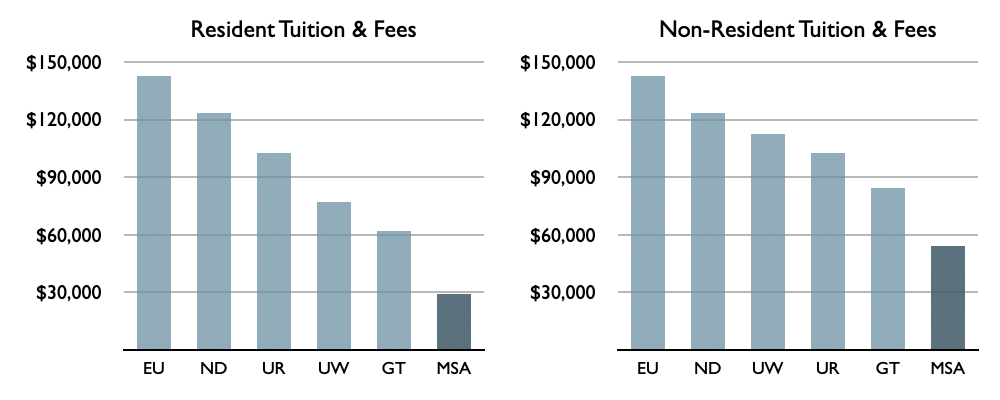
Tuition and Fees ($000) |
54 |
113 |
143 |
112 |
85 |
103 |
124 |
|
Tuition and Fees – Residents |
29 |
102 |
143 |
77 |
62 |
103 |
124 |
|
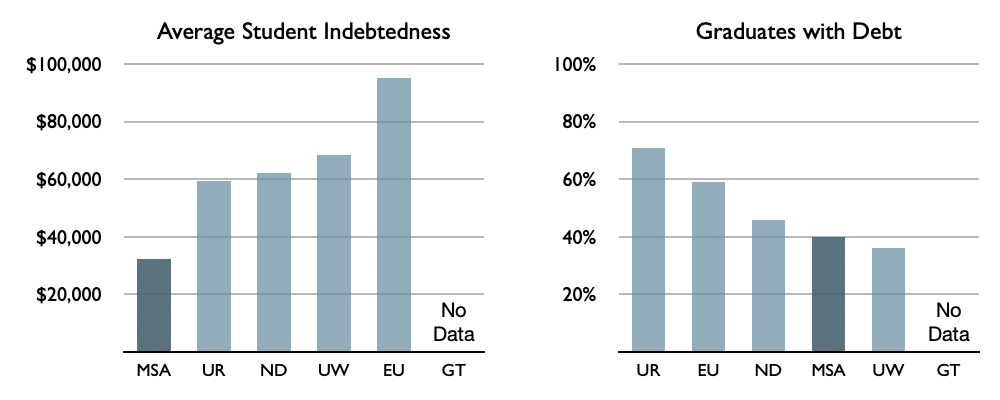
Average Indebtedness ($000) |
32 |
71 |
95 |
68 |
NA |
59 |
62 |
|
Students with Debt |
40% |
59% |
59% |
36% |
NA |
71% |
46% |
|
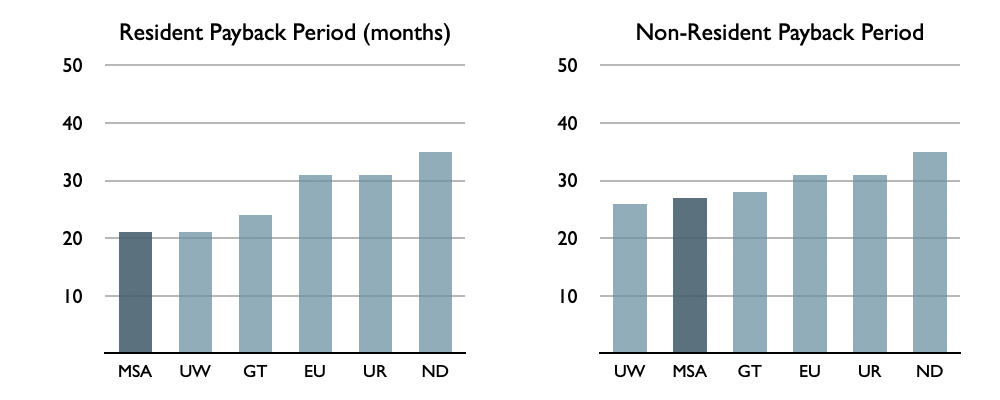
ROI Payback Period (months) |
27 |
30 |
31 |
26 |
28 |
31 |
35 |
|
ROI Payback Period – Residents |
21 |
28 |
31 |
21 |
24 |
31 |
35 |
|
|
MSA |
Mean |
EU |
UW |
GT |
UR |
30 |
| Source of business school data: U.S. News | |||||||
Annual Benchmark Report
The Annual Benchmark Report is updated and made available each year in April.
- 2023 Benchmark Report
- 2022 Benchmark Report
- 2021 Benchmark Report
- 2020 Benchmark Report
- 2019 Benchmark Report
- 2018 Benchmark Report
- 2017 Benchmark Report
- 2016 Benchmark Report
- 2015 Benchmark Report
- 2014 Benchmark Report
- 2013 Benchmark Report


