Graduate Future Plans Survey
The Office of Institutional Strategy and Analysis at NC State University is charged with measuring and reporting student outcomes for degree earners each academic year. Known as the Graduate Future Plans Survey (GFPS) for masters and doctorate recipients, data are collected through three surveys implemented to cover graduates for fall, spring and summer. The results are published a year after the Institute’s students graduate. The first survey was published for the academic year (AY) 2018-19.
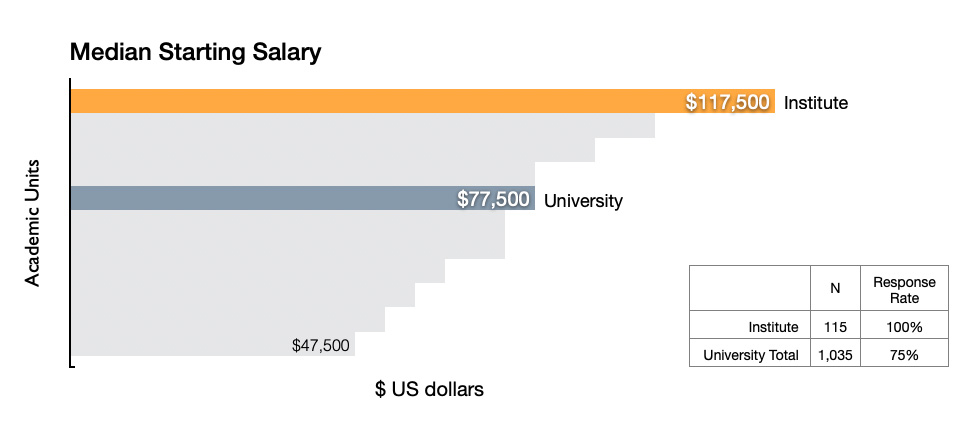
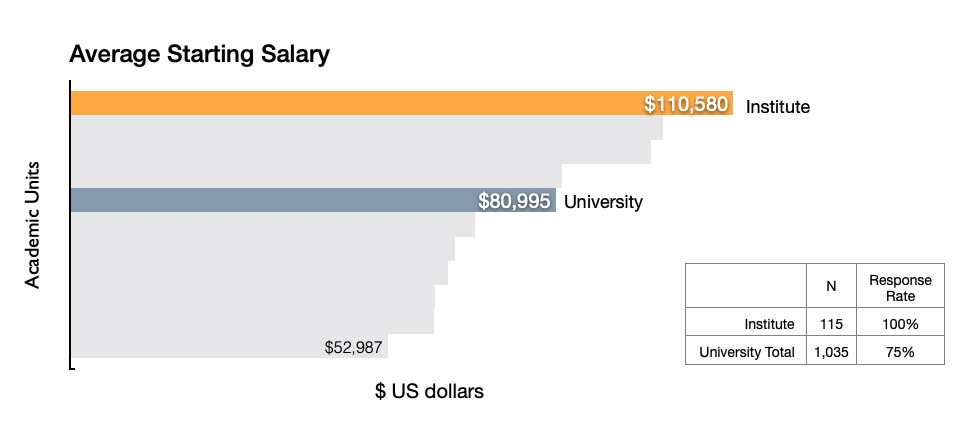
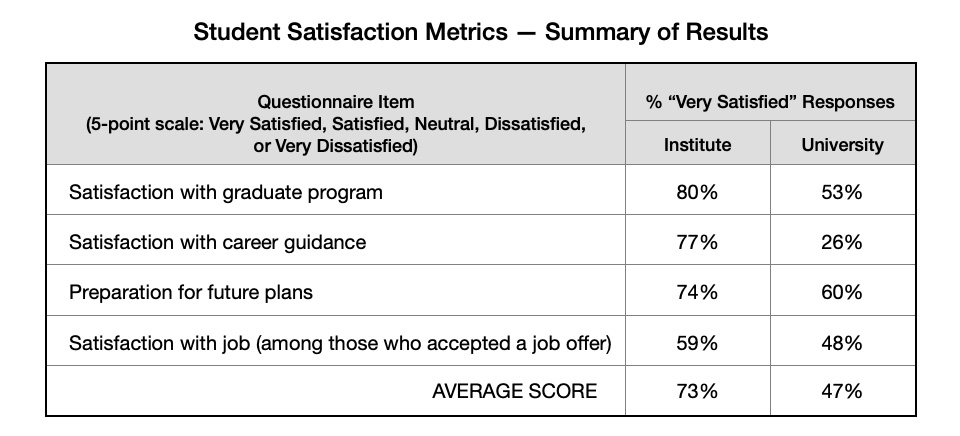
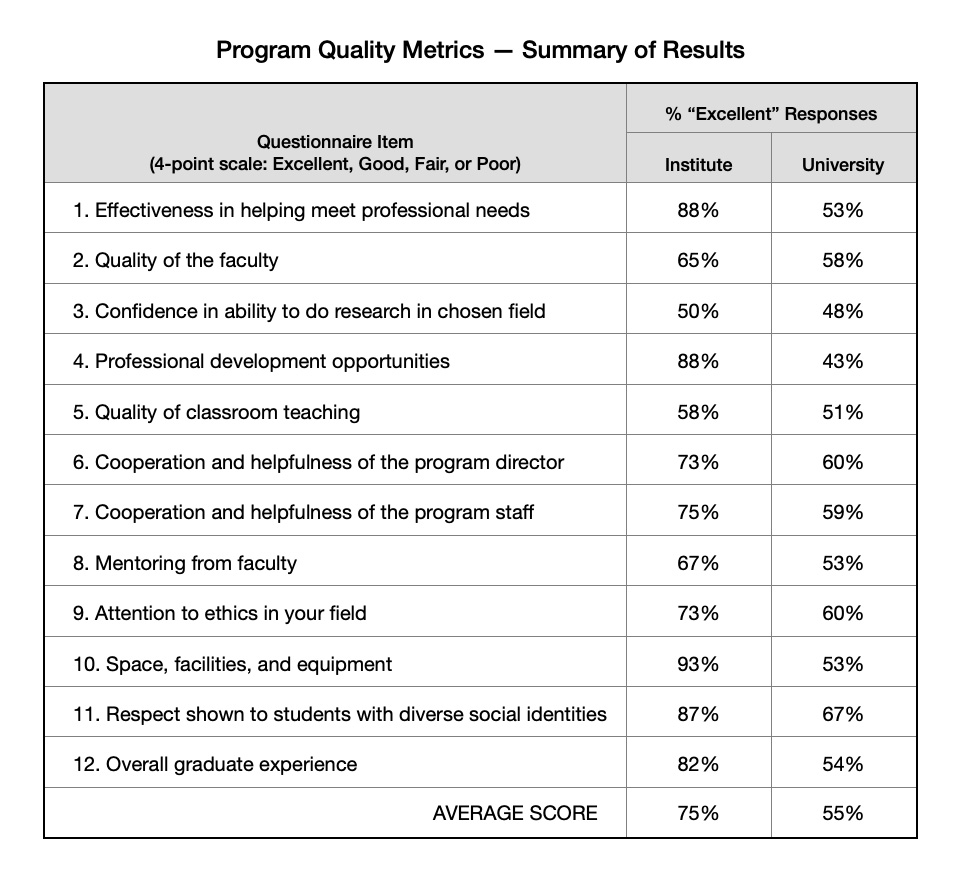
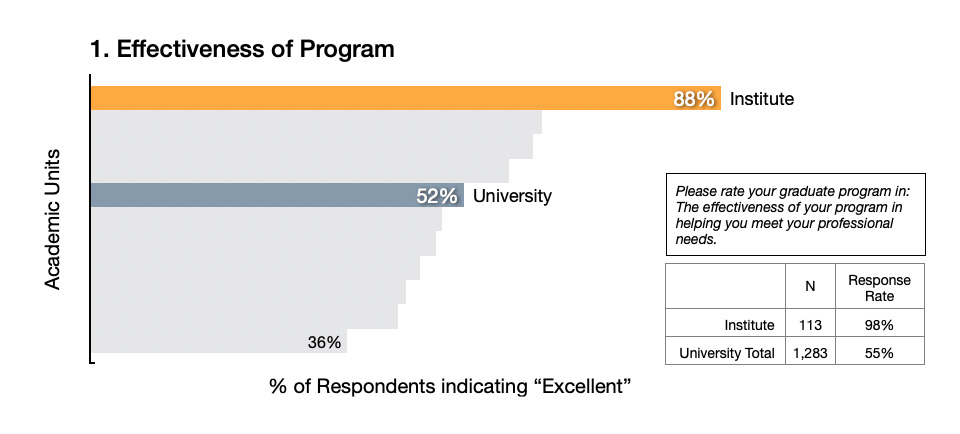
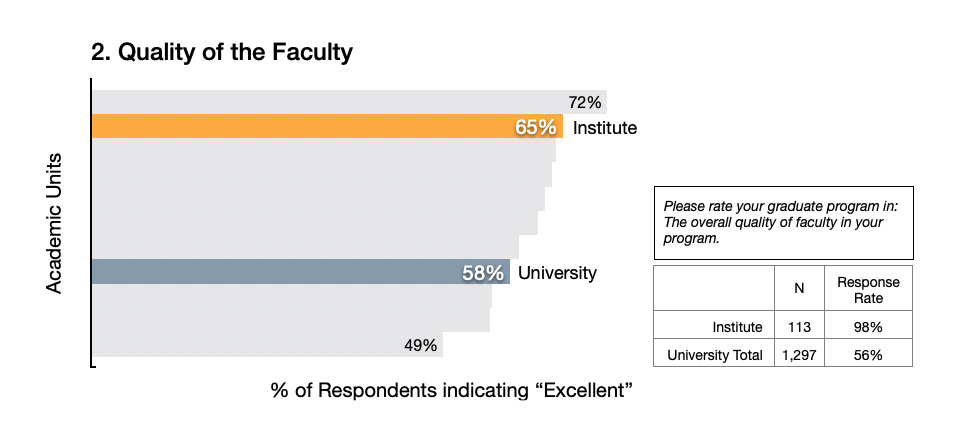
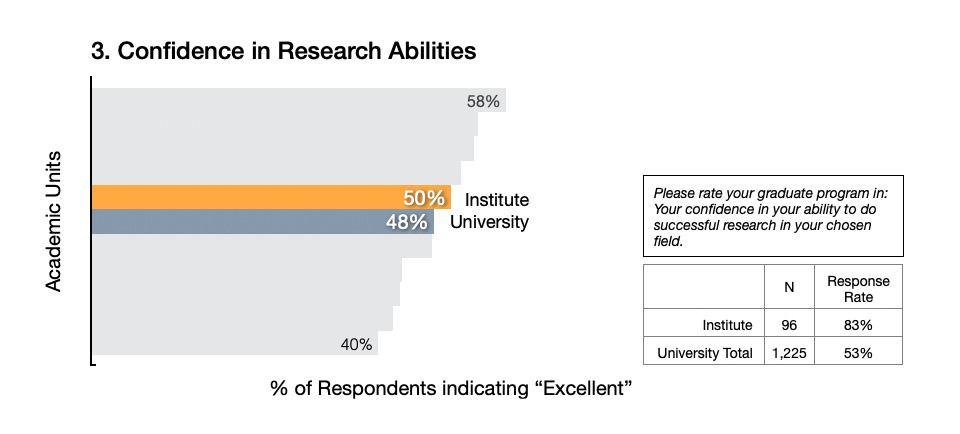
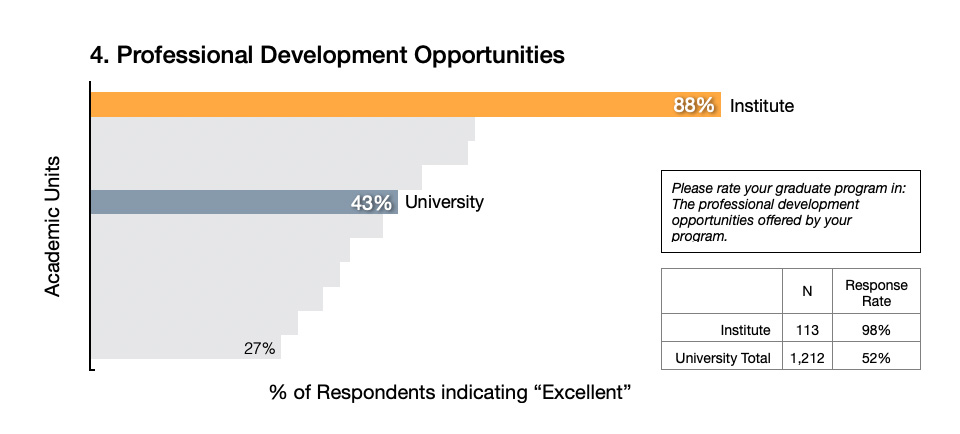
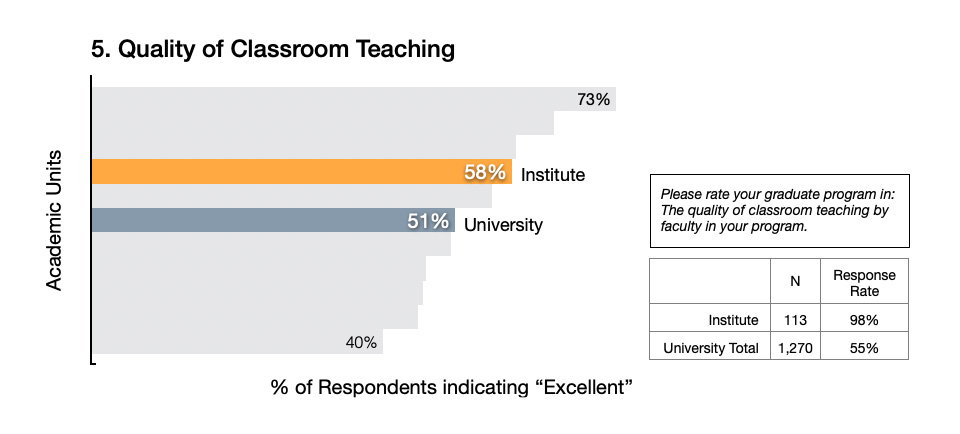
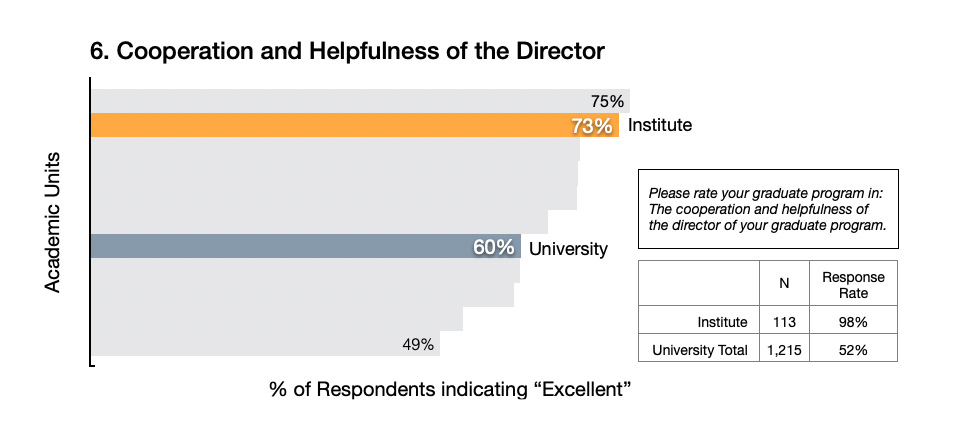
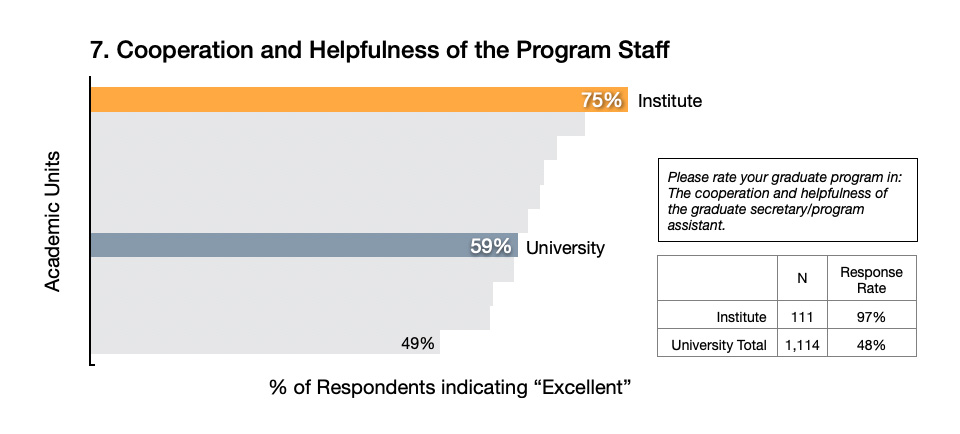
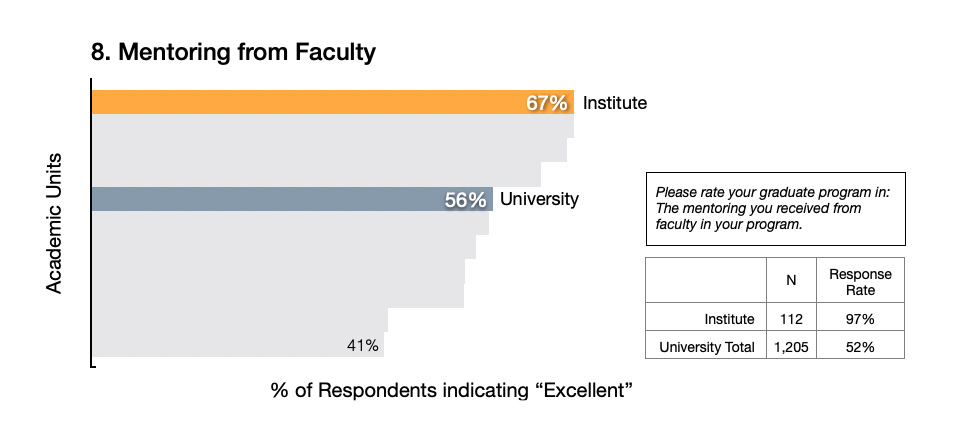
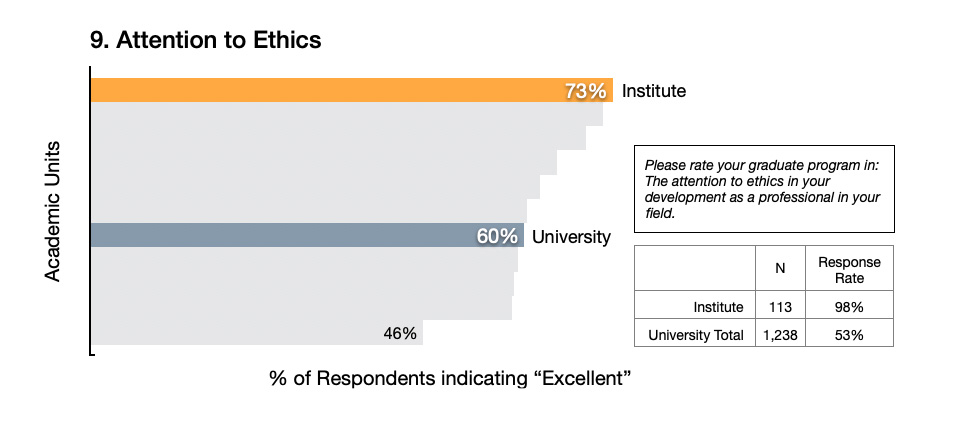
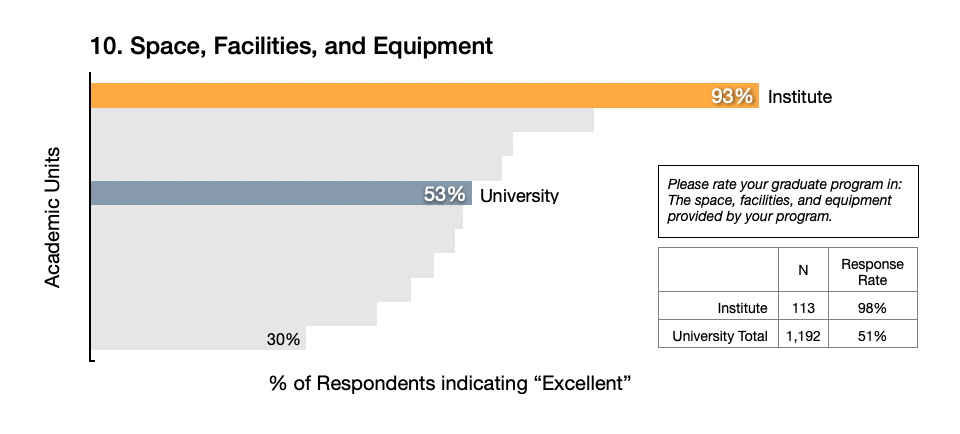
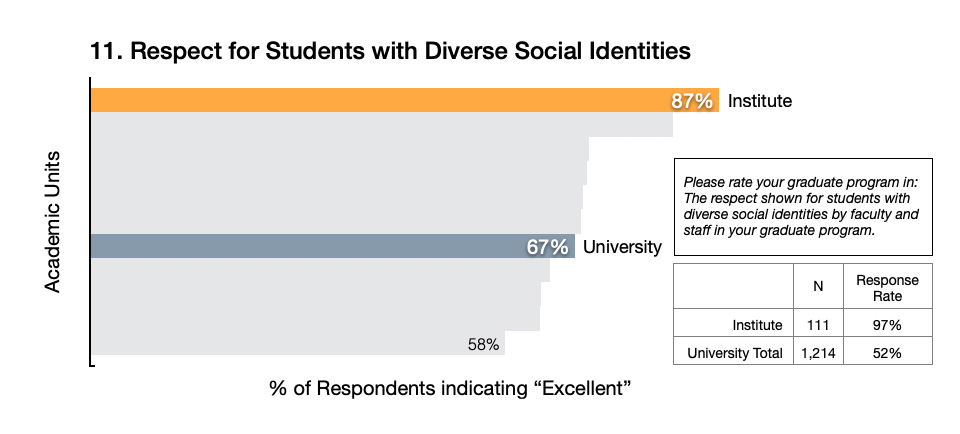
The survey data presented here illustrate the Institute’s outcomes relative to the results for other academic units within the University (that is, the ten colleges), and the university’s overall average for master’s degree graduates for the period of observation. The analysis focuses on the frequency of the top ratings (i.e., %-Excellent, or %-Very Satisfied) on each metric, based on a 4-point scale (excellent, good, fair, or poor), or 5-point scale (very satisfied, satisfied, neutral, dissatisfied, or very dissatisfied).
The Institute’s students have a high survey participation rate, ranging from 96-100% each year. The response rate for the University ranges between 59-69%. Although the Institute is the University’s smallest academic unit, it produces more master’s degree graduates than 4 of the 10 colleges, and is among the top-5 largest producers of M.S. graduates when ranked along side the roughly one-hundred M.S. programs offered by the university.
Academic Year 2021-22 Survey Results
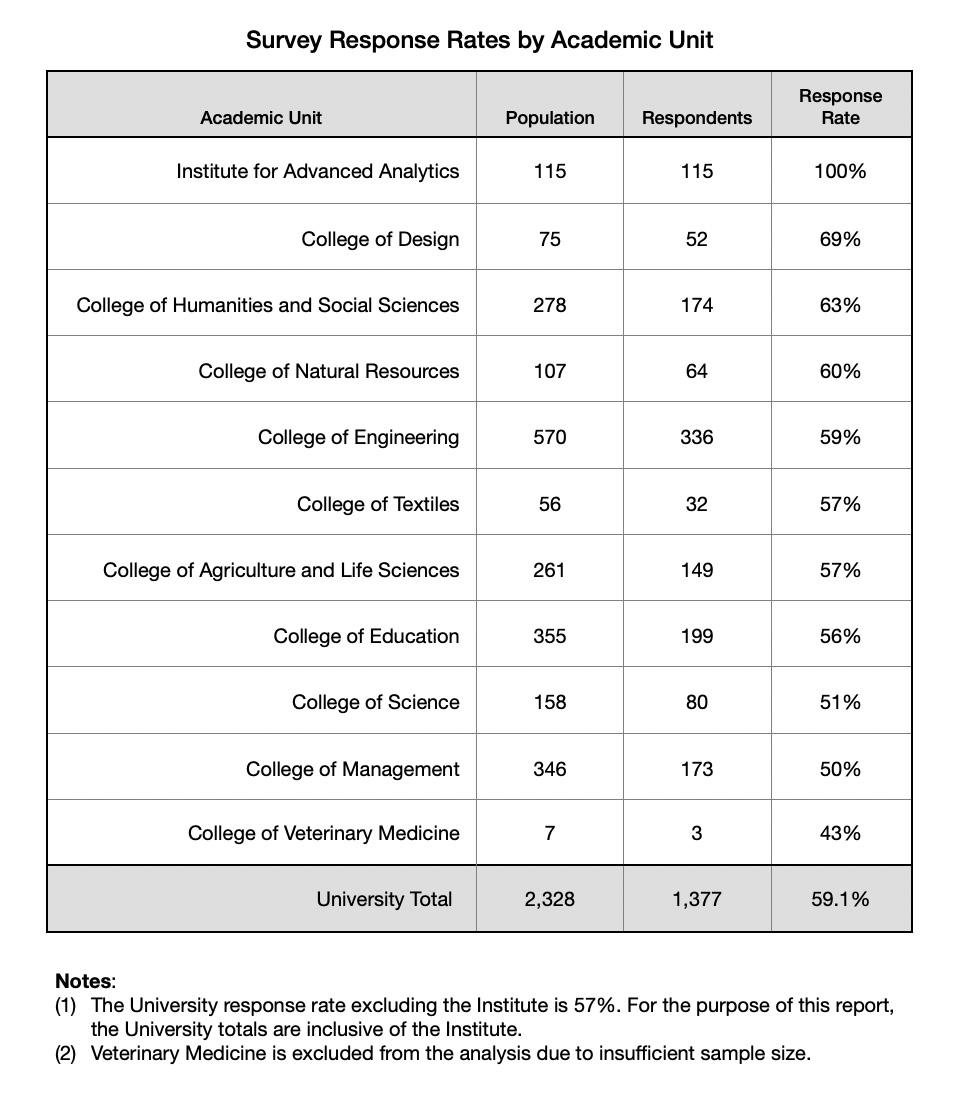
Only a small number of programs have 50 or more graduates participating in the Survey each year. Most programs have too few respondents, or too low a response rate, to have reliable results at the program level.
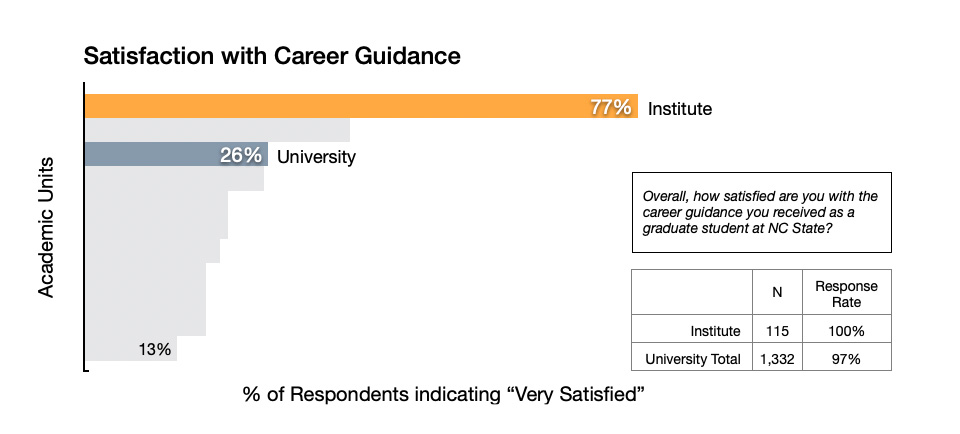
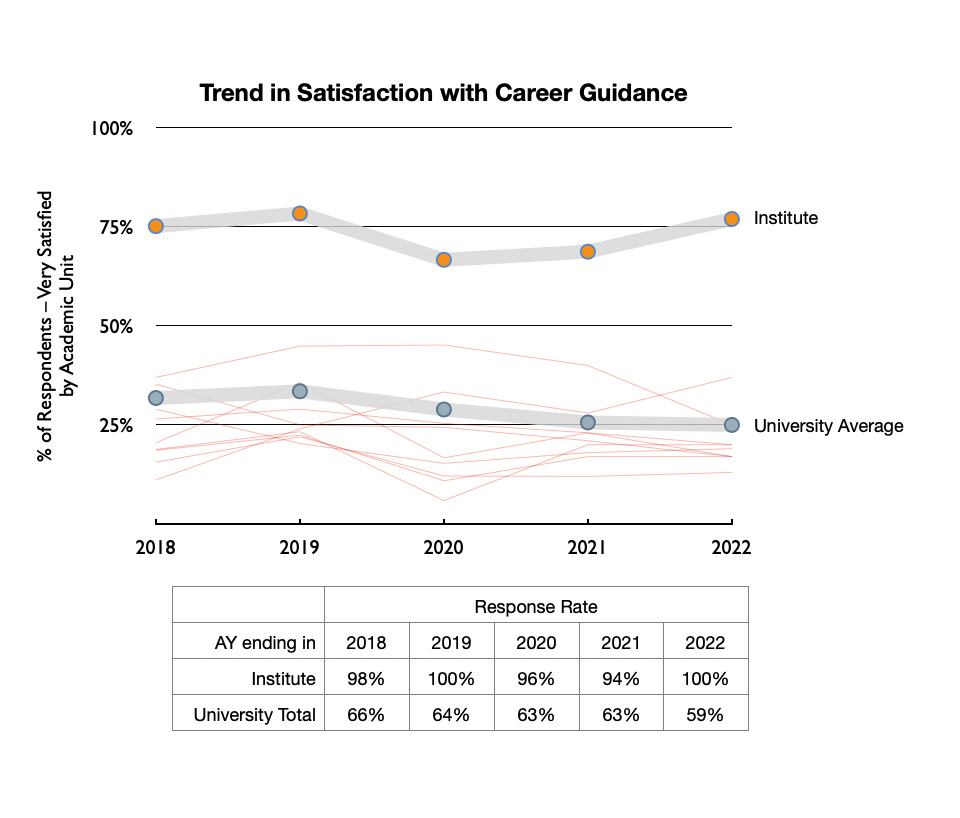
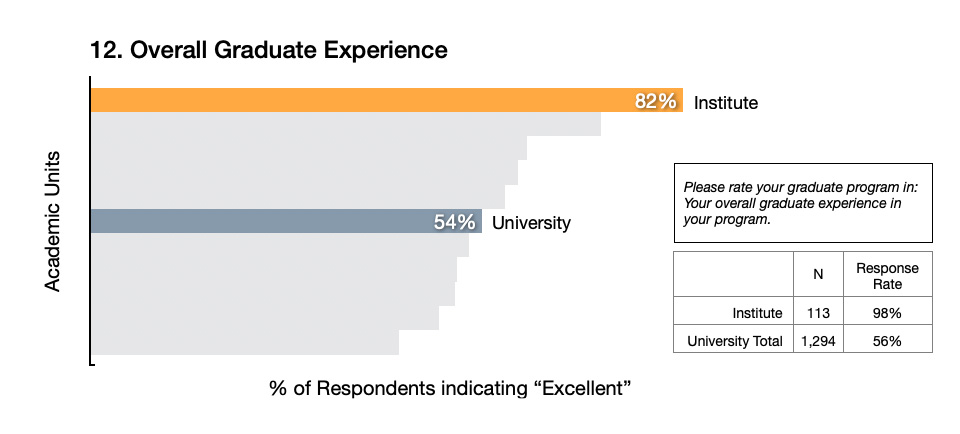
Student Satisfaction
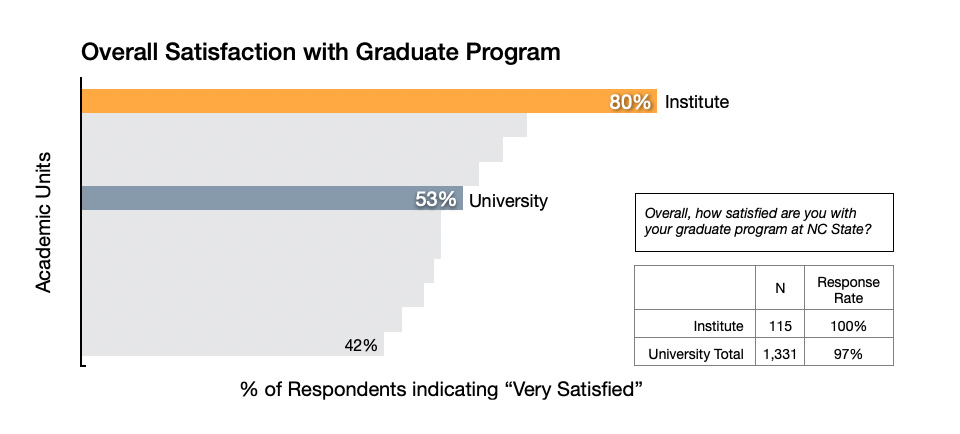
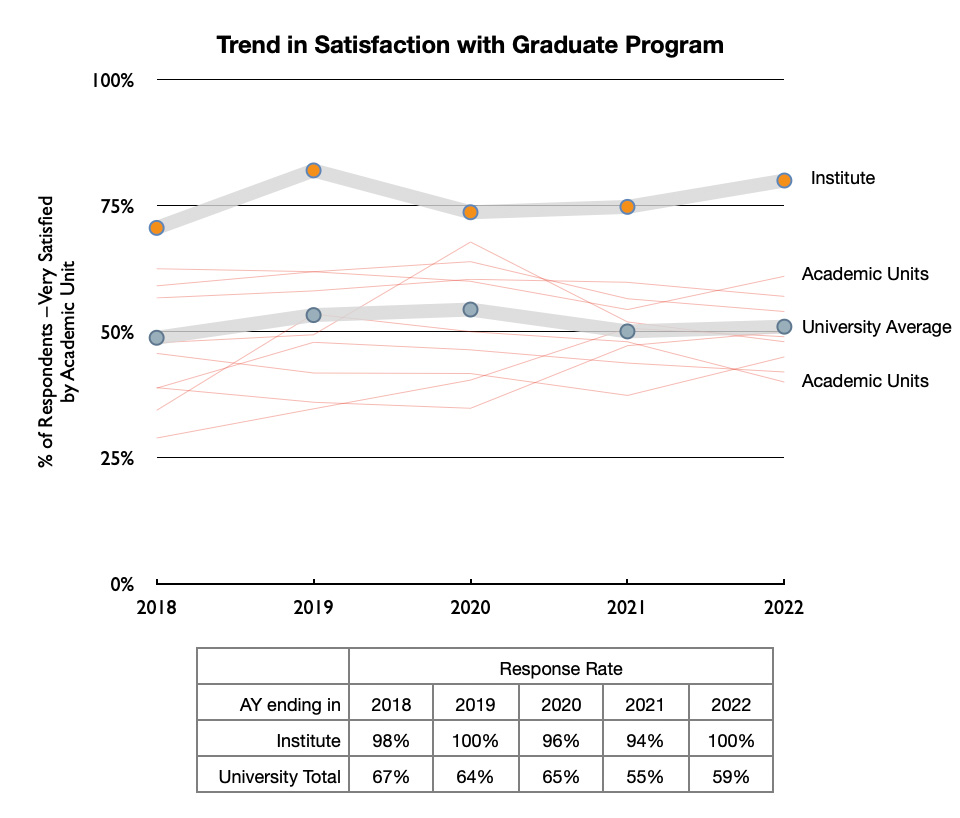
Program Quality
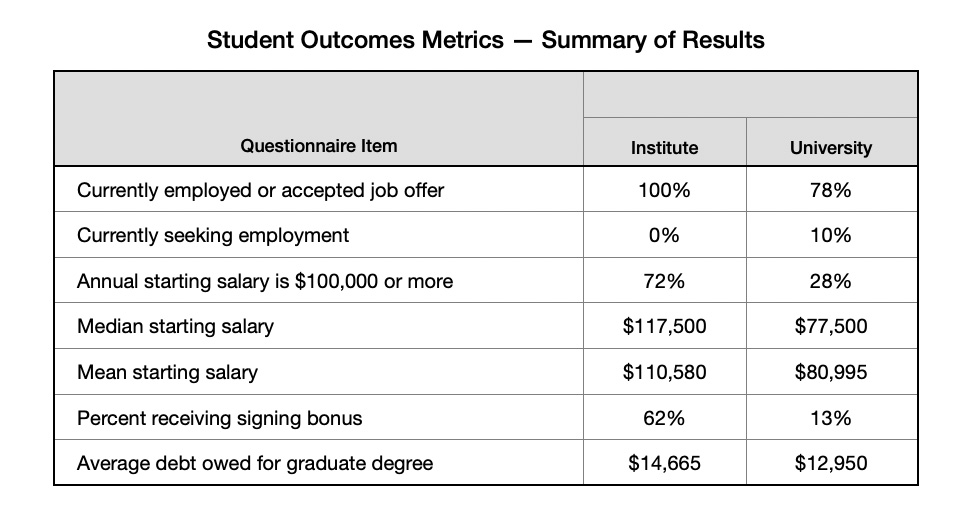
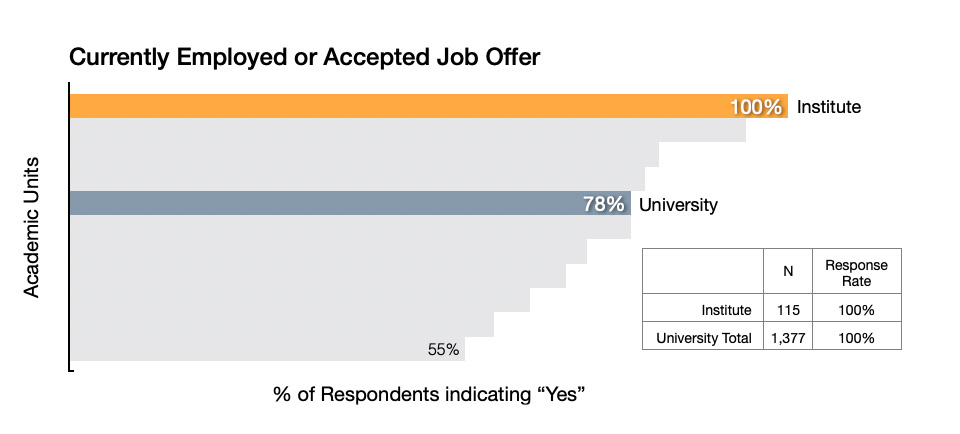
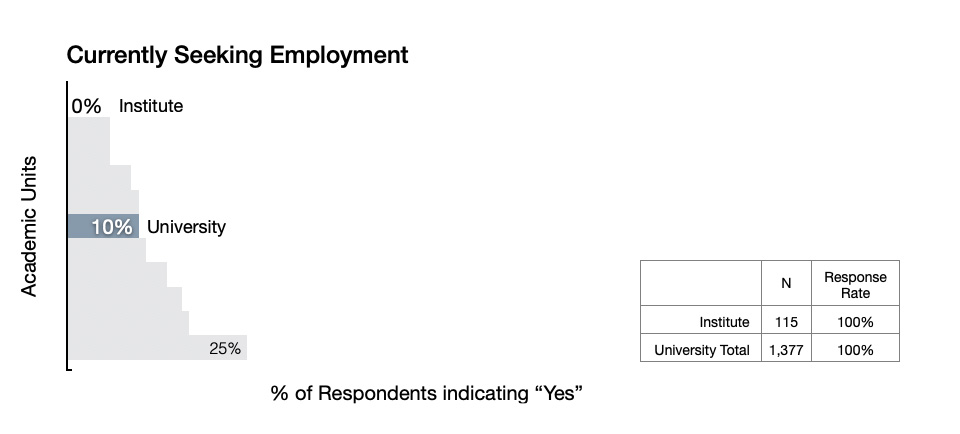
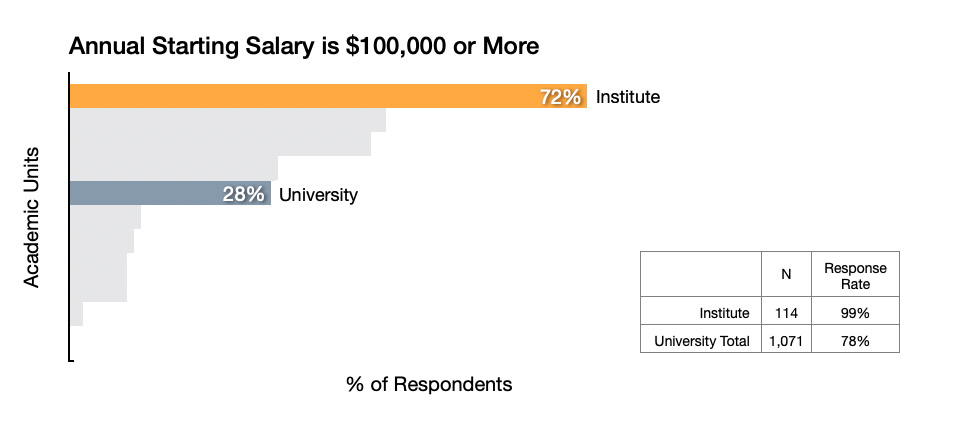
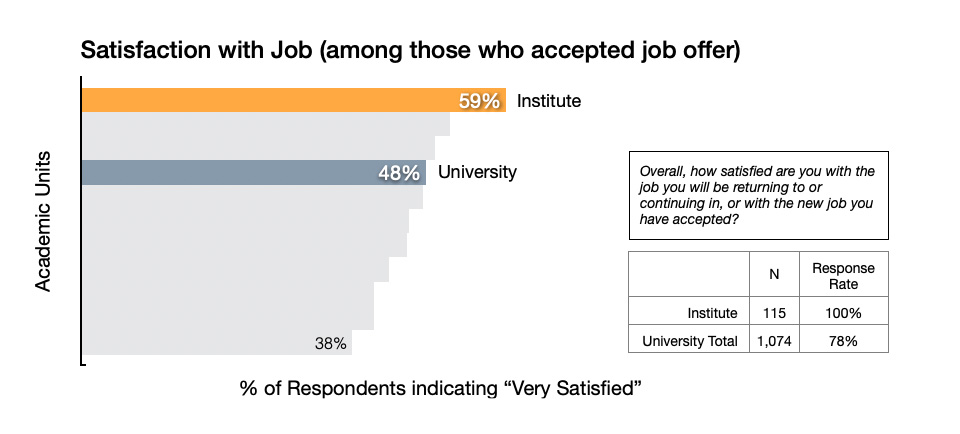
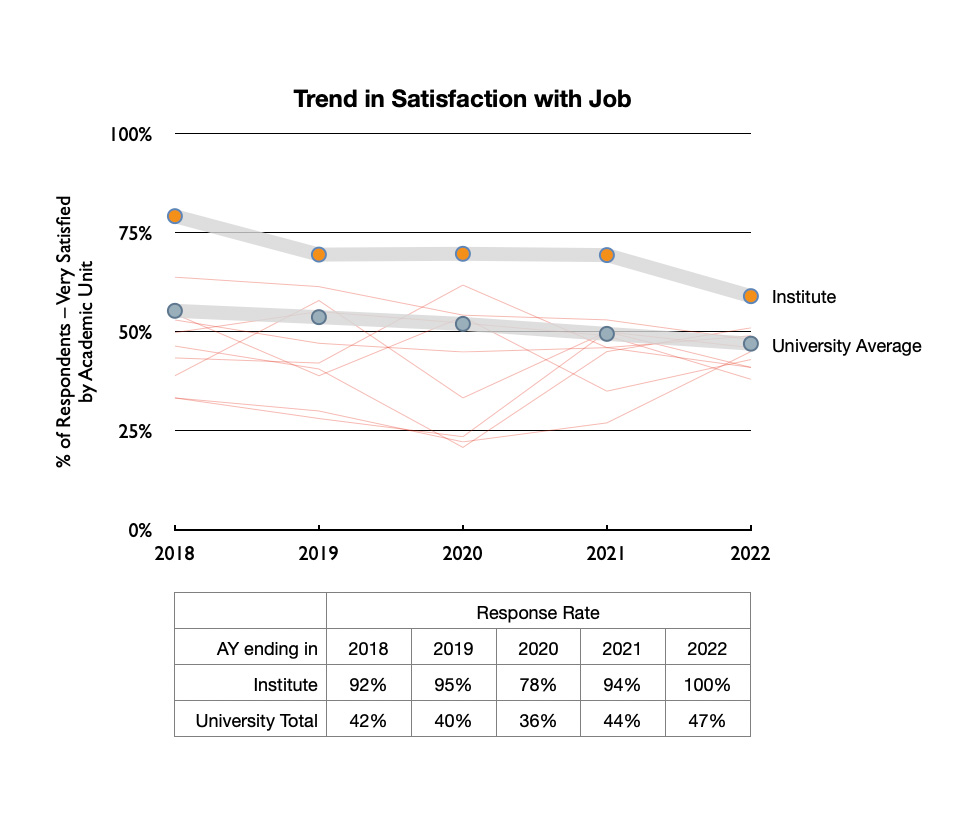
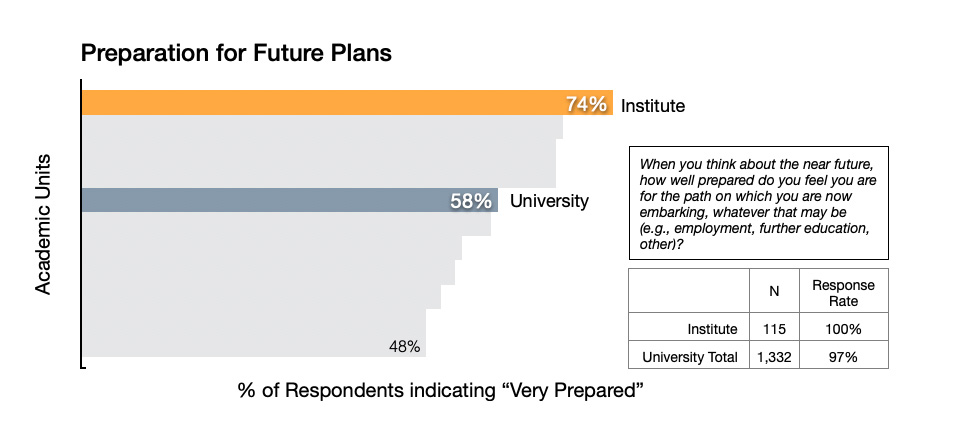
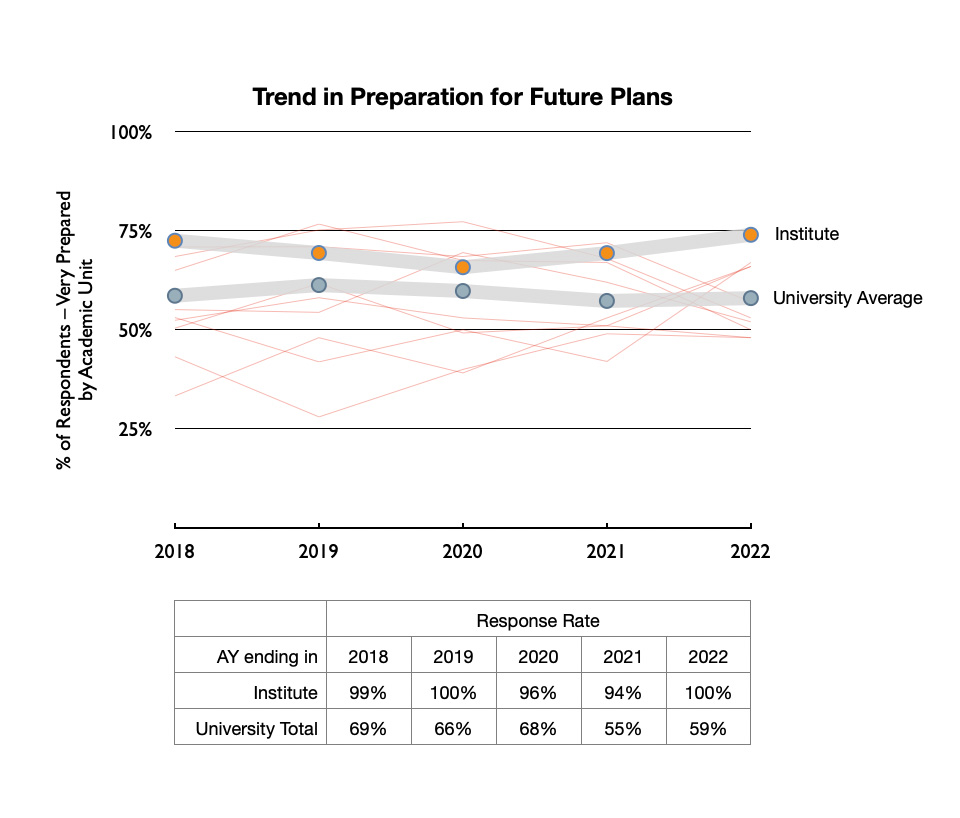
Student Outcomes